| What Every Development Team is missing .. |
|
"Month -end figures do not match the Business Office totals."
"Donors from < insert event, campaign, fund or appeal name here> are down. Why?"
"What region or segment does our mailing work best? Least?"
"Name the top 25 donors in your database."
With strained economic conditions still permeating, many clients work harder to deliver performance and revenue goals. From events to campaigns, having time to analyze results is fleeting at best, when data errors, mismatched totals and other trending problems appear.
|
 |
| What Your Development Analysis is Missing |
|
|
 |
| Pivot Table Transforms Analysis Needs |
|
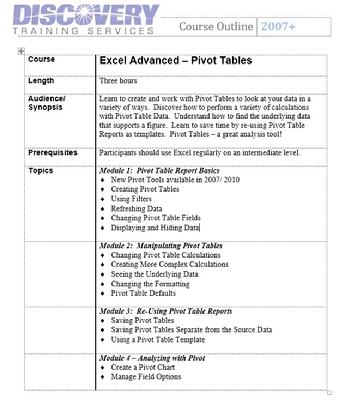
| The solution is Excel Pivot Tables, a transformative analysis tool to extract and review large sets of data. The linked table set empowers a basic Excel user to manipulate data trends quickly. With powerful sort and filter features, the new Pivot tool accelerates the time to make sense of monthly, quarterly and year -end trends.
New Chart:
With one click, users can also create a Pivot chart and visualize the fundraising, budget, response patterns. The Microsoft redesign, which began with 2007 version, increases the user flexibility with templates, conditional formatting, table design and imbedded slicer and calculation tools. Database, development and fundraising teams can learn this tool in an easy three hour course, with a DTS instructor facilitating hands-on labs.
Use your own data, customize your own course and understand corporate trends on a whole new level. Join hundreds of teams jumping onto Team Pivot training -- email the Registrar today!
|
|